Types of Regression Shapes
Stock prices follow different regression-based shapes over time due to the dynamic interplay of fundamentals, macroeconomic factors, and market sentiment. These best-fitted regression shapes help in identifying trends, support, resistance, and breakout points. Below are the key regression shapes used in stock price analysis:
1. Upward/Downward Regression
A best-fitted linear trendline that slopes either upward or downward, representing the overall stock price movement.
- Middle Line: The best-fitted trendline.
- Upper & Lower Bands: Capture price deviations (volatility spread) around the trend.
- Usage: Identifies stable trends, support/resistance zones, and momentum shifts.
✅ Correct in concept – Regression channels work this way in trend analysis.
2. Asymptotic Growth Curve
A trend where stock price initially rises exponentially but then flattens, acting as a natural resistance level.
- Early Phase: Rapid price acceleration.
- Later Phase: Slows down as valuation limits or fundamental constraints kick in.
- Usage: Seen in companies reaching market saturation or speculative bubbles topping out.
✅ Correct in concept – Used in growth models like logistic or Gompertz curves.
3. Exponential Growth / Decay Curve
- Exponential Growth: A stock price that rises sharply over time, indicating strong compounding growth.
- Exponential Decay: A rapid decline in stock price, often due to fundamental deterioration or panic selling.
- Usage: Captures aggressive rallies (e.g., tech stocks, cryptos) and sudden crashes.
✅ Correct in concept – Seen in momentum stocks, speculative bubbles, and crashes.
4. Power Regression Curve
A stock price trend where the rate of increase or decrease follows a power-law function rather than a straight line.
- Typically seen in: Growth stocks with compounding returns, commodities, and long-term secular trends.
- Usage: Helps in detecting whether a stock is accelerating beyond normal trend expectations.
✅ Correct in concept – Power-law relationships are widely studied in financial markets.
5. Concave Up / Concave Down Regression (V/U/Oval Shapes)
- Concave Up (U-Shape Recovery): A slow decline followed by a steady recovery.
- Concave Down (Oval / V-Shape Drop): A sharp fall followed by a rapid rebound (V-shape).
- Usage: Seen in short-term price actions like bear market recoveries or panic-driven drops.
✅ Correct in concept – These patterns reflect market structure and reversals.
6. Polynomial / Quadratic Polynomial Regression
A non-linear best-fitted line that creates an arc-shaped trend, commonly used with regression channels.
- Captures: Multi-phase market trends where price accelerates and then decelerates.
- Usage: Detects long-term trend shifts and breakouts.
✅ Correct in concept – Polynomial regression is widely used in trend modeling.
7. Homoscedasticity & Heteroscedasticity Regression Shapes
- Homoscedasticity: A stock price follows a consistent variance pattern (square/rectangular shape).
- Heteroscedasticity: Price variance increases or decreases over time, forming a triangle, wedge, or funnel shape.
- Usage: Helps in identifying volatility expansion/contraction phases.
- ✅ Correct in concept – Homoscedasticity means constant variance (stable fluctuations). Heteroscedasticity means changing variance (market uncertainty or trend transition).
8. Cyclical Wave Regression
A long-term uptrend, downtrend, or sideways trend that contains high-amplitude price waves within it.
- Captures: Sector cycles, business cycles, and repeating market patterns.
- Usage: Helps in timing sector rotations and macroeconomic cycles.
✅ Correct in concept – Used in economic cycles and mean-reverting stocks.
9. Sigmoid Function (S-Curve Regression)
A trend that forms an S-shape, representing three phases:
- Rounded Bottom: Slow accumulation.
- Sharp Upward Move: Strong breakout phase.
- Rounded Top: Market saturation, potential reversal.
- Usage: Seen in high-growth companies, innovation cycles, and market manias.
✅ Correct in concept – This is common in technology adoption curves and stock bubbles.
10. Log-Logarithmic Regression Curve
A stock price trend that rises or falls at a decreasing rate—strong in the early phase but slows over time.
- Captures: Diminishing returns or deceleration of trend strength.
- Usage: Useful for long-term compounding growth models.
✅ Correct in concept – Logarithmic scaling is used in long-term financial modeling.
Why Regression Analysis Outperforms Traditional Technical Analysis
Regression Analysis is a scientific, data-driven method that accurately captures how stock prices move in response to underlying fundamentals like revenue, cash flows, macroeconomic conditions, and more. By analyzing these variables simultaneously, regression creates a mathematically precise, best-fitted line or channel that clearly identifies long-term support, resistance, breakouts, and trends.
On the other hand, Traditional Technical Analysis (TA) primarily relies on investor psychology—fear and greed—and represents only short-term market fluctuations. TA trendlines are often drawn subjectively by connecting price peaks or lows, failing to incorporate the fundamental drivers behind the moves. Thus, traditional TA usually captures short-term volatility, ignoring crucial fundamental signals, resulting in more frequent false breakouts.
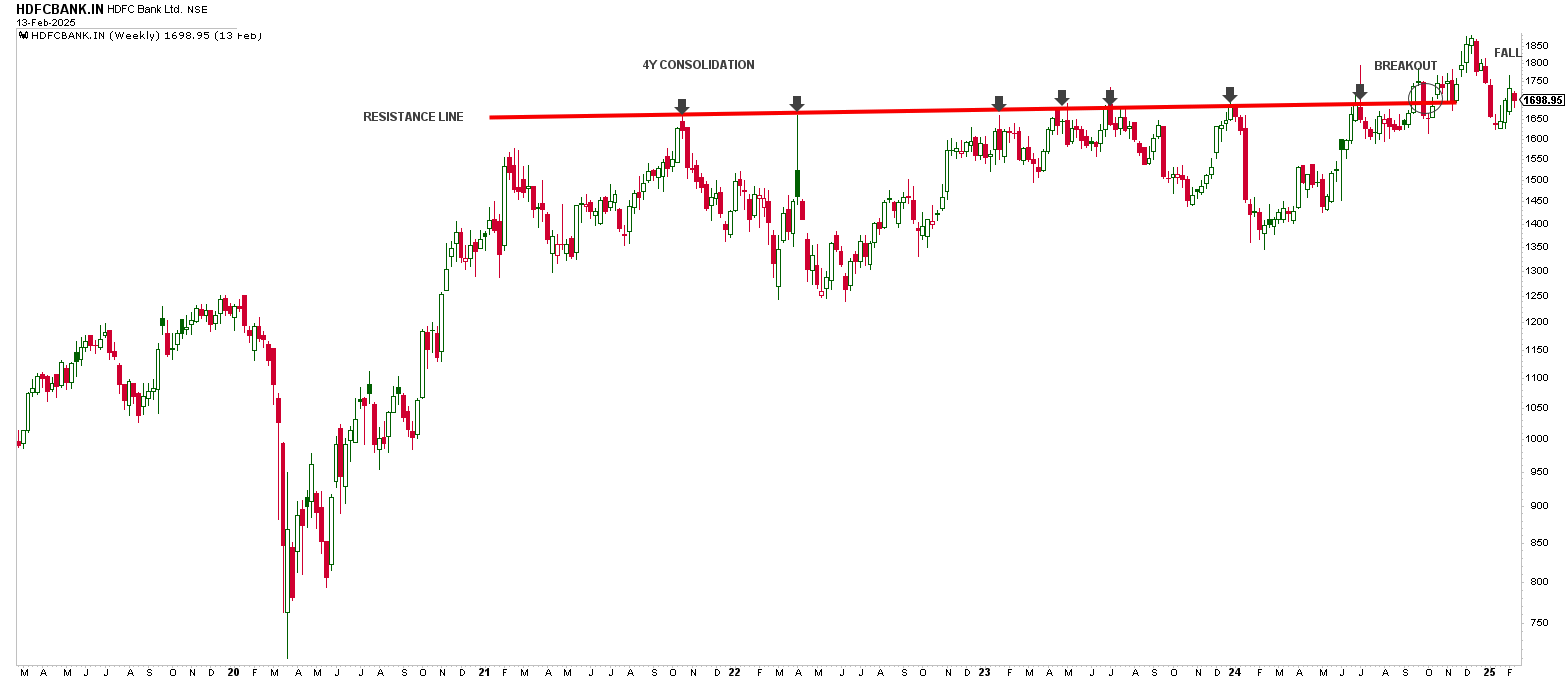
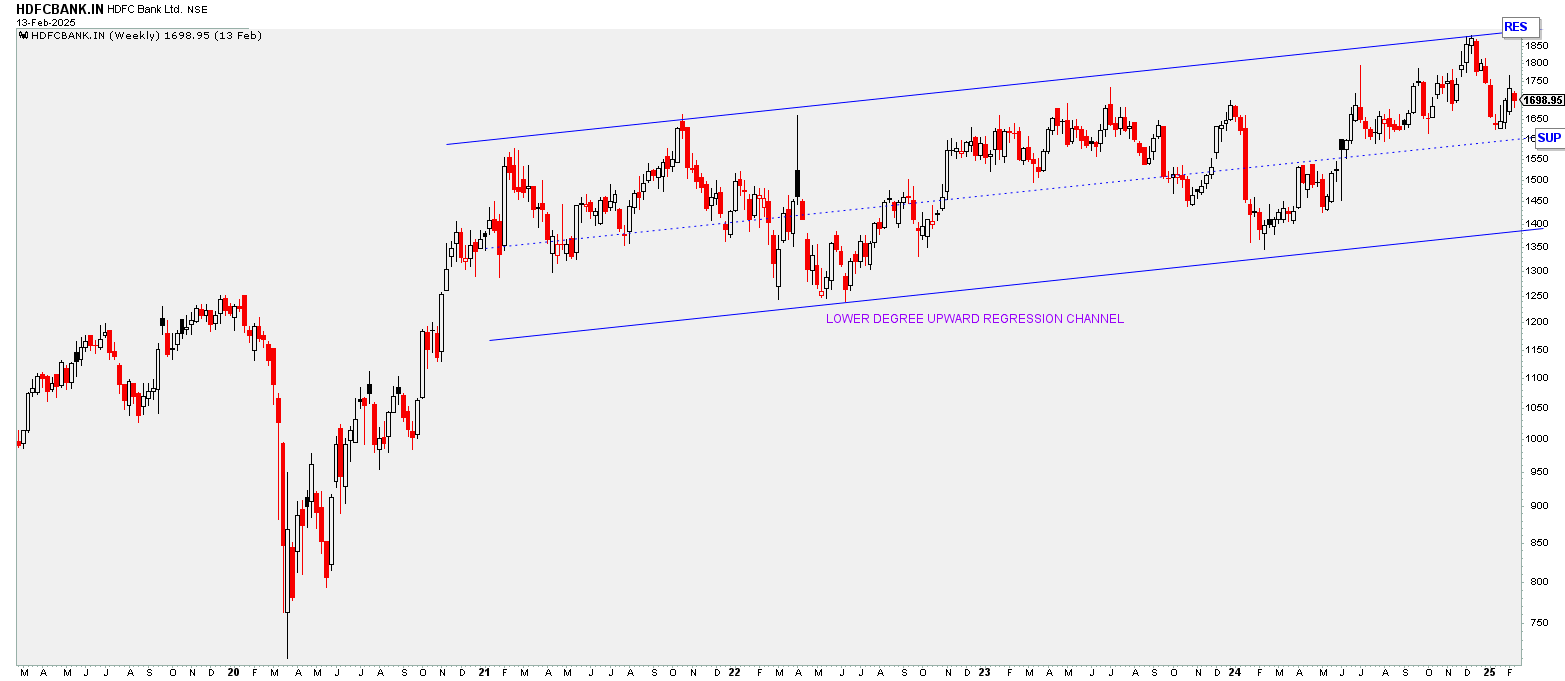
Real-World Example: HDFC Bank
Consider this HDFC Bank example:
- Traditional TA identifies resistance by simply connecting peak points, suggesting a breakout after 4 years of consolidation. Shortly after this breakout, the price falls back again, resulting in a misleading signal.
- Regression-based analysis, however, draws a statistically accurate best-fitted upward regression channel, clearly indicating that the stock is still within its genuine resistance zone, preventing premature trading decisions. Thus, it avoids false signals and provides more reliable insights.
Why Regression Analysis is Better:
- ✅ Data-Driven: Captures fundamentals behind price moves.
- ✅ Objective: Reduces emotional bias (fear & greed).
- ✅ Real-Life Utility: Used widely in financial research, investing, and AI applications.