Gold's 40-Year Price Cycle
Visualization:
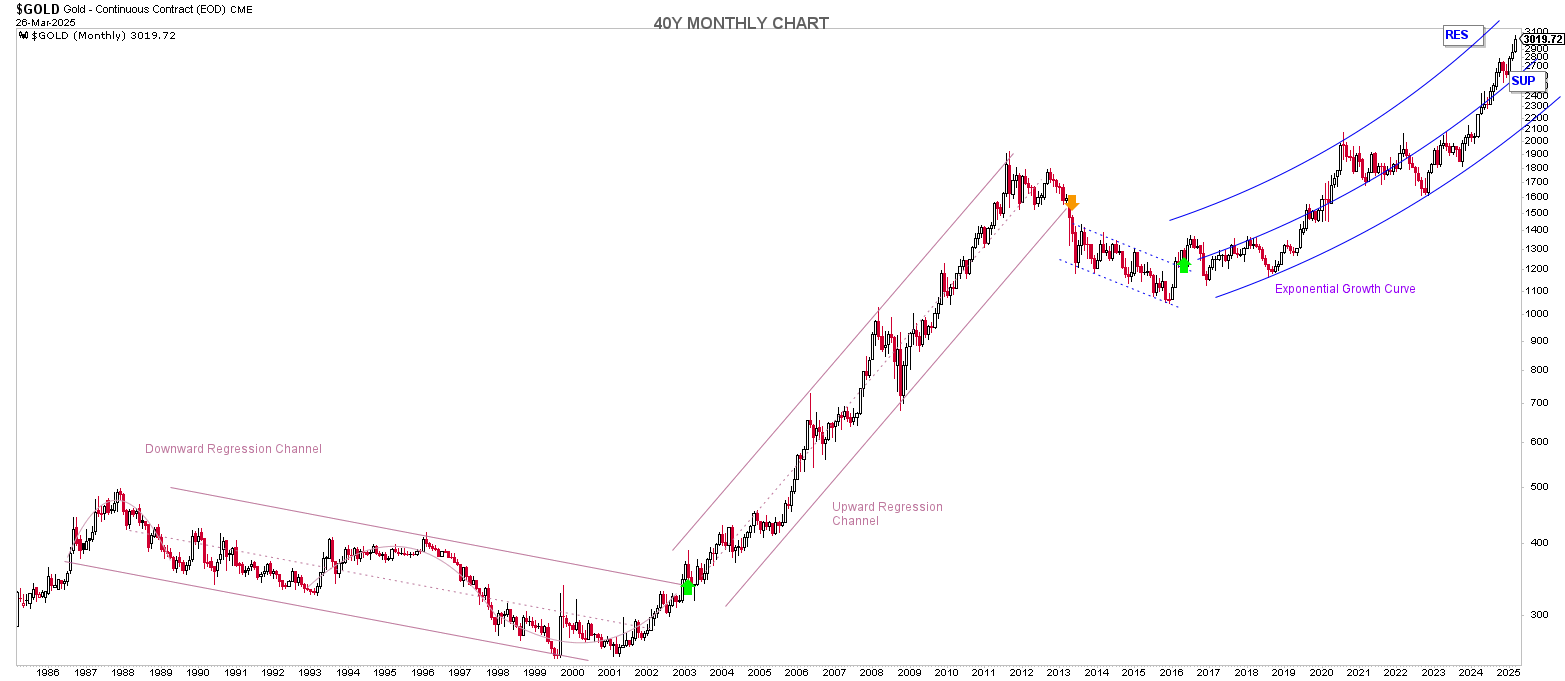
Include a clear 40-year gold price chart showing distinct regression channels and phases (downward, upward, and consolidation periods clearly marked).
Key Analytical Questions for Learners:
1. The Long Downward Regression Channel (1988–2003)
- Why did gold prices remain
in a downward regression channel for 15 years (1988–2003)?
- What macroeconomic conditions or market forces caused sustained downward pressure?
- How did interest rates, inflation, economic growth, and investor sentiment contribute during this period?
- Why did many investors lose money despite investing in what is traditionally considered a "safe haven"?
2. The Massive 5X Growth Phase (2003–2013)
- Why did gold prices surge
fivefold from 2003 to 2013?
- What fundamental shifts occurred globally during this decade?
- How did factors such as geopolitical uncertainty, quantitative easing, falling interest rates, and the 2008 financial crisis influence gold’s explosive rally?
- What lessons can investors draw about identifying macroeconomic signals and entering at the right time?
3. Consolidation & Lower-Side Trend (2013–2020)
- Why did gold prices stagnate
and trend sideways from 2013–2020?
- What changed in global economies, interest rate cycles, or market sentiment that halted gold’s growth?
- How does investor psychology (fear, greed, market sentiment) factor into prolonged consolidations?
4. Timing is Everything (Practical Lessons)
- Why does timing matter, even in historically safe assets like gold?
- Can an investor reliably use regression channels to identify optimal entry and exit points in gold or other commodities?
- What does this teach investors about the importance of cycle recognition versus buying assets blindly?
How to Analyze:
Encourage students to:
- Research historical macroeconomic events (interest rates, inflation, geopolitical crises, monetary policies, gold reserves by countries) during these specific time frames.
- Understand gold’s relationship with other economic indicators (currency strength, equity markets, inflation-adjusted returns).
- Discuss why even safe assets have defined cycles, and how identifying these cycles helps avoid costly investment mistakes.
Resources and Data to Explore:
Provide the following links to empower learners to gather insights:
- World Gold Council Historical Data
- Federal Reserve Economic Data (FRED) – interest rates, inflation, GDP
- Macrotrends Gold Price Historical Chart
- Investopedia’s Guide to Investing in Gold
Objective:
This case study encourages learners to develop analytical thinking by linking economic events and market psychology to gold’s price movements. By combining regression analysis with fundamental research, students gain actionable insights into timing and investment cycles.